TUTORIAL TO MAKE BETTER USE OF THE VIEWER'S RESOURCES
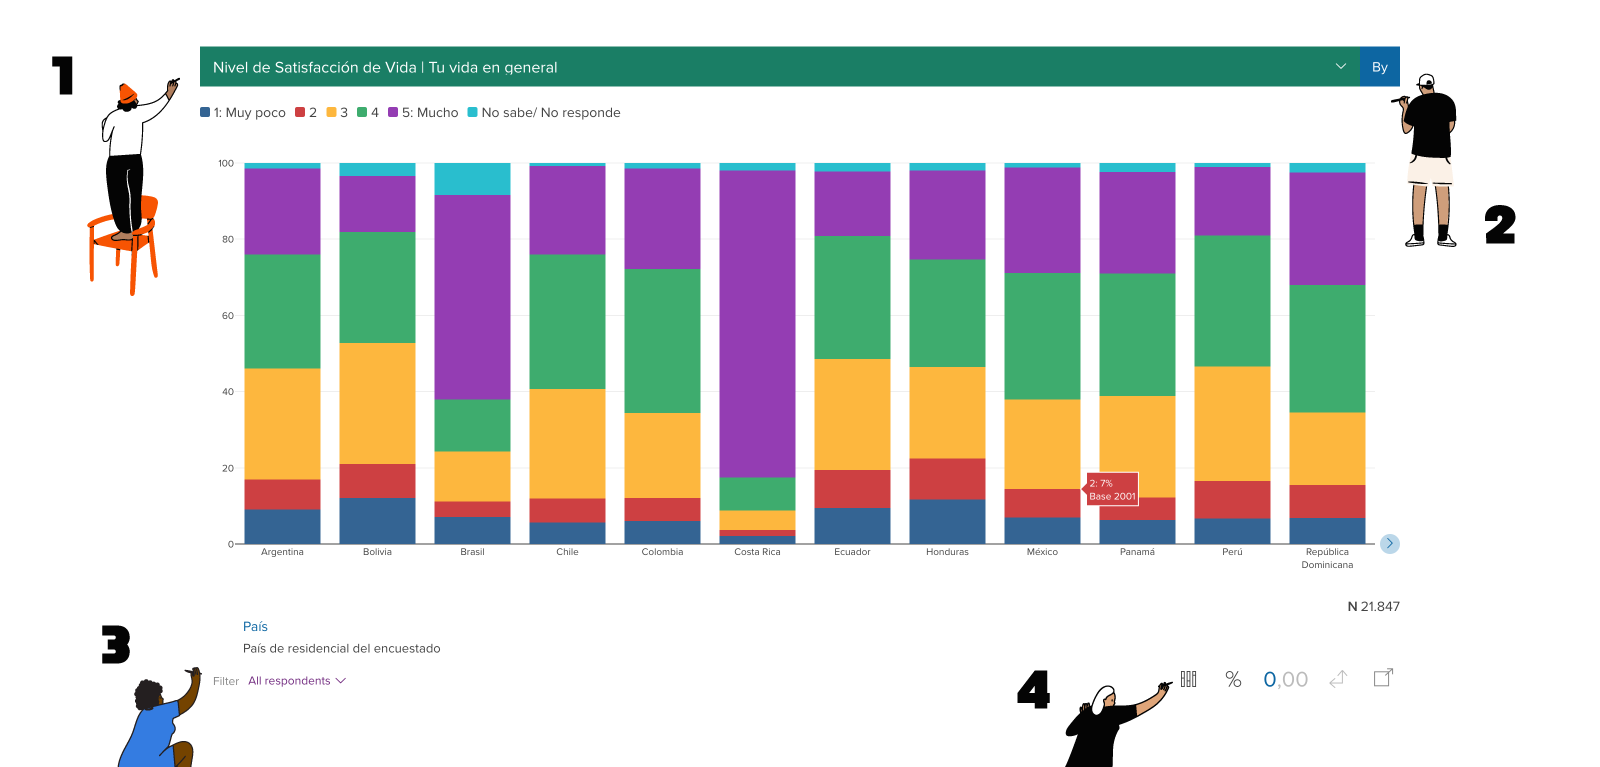
Would you like to see the data on a regional comparative basis? Do the following:

1
In the green button always make sure that the question you want to see is selected.
2
In the blue "By" button select "Country".
3
In "Filter", located at the bottom left of the display, select "All respondents".
4
For the visualization of these data, you have the possibility to select different types of graphs. Choose the one you want.
IMPORTANT: this is the only type of graph where the "All respondents" option can be selected since the statistical significance of the data is at the national, not regional, level.
NOTE: If you hover your cursor over the display you will see the percentage and the basis on which that percentage was calculated.
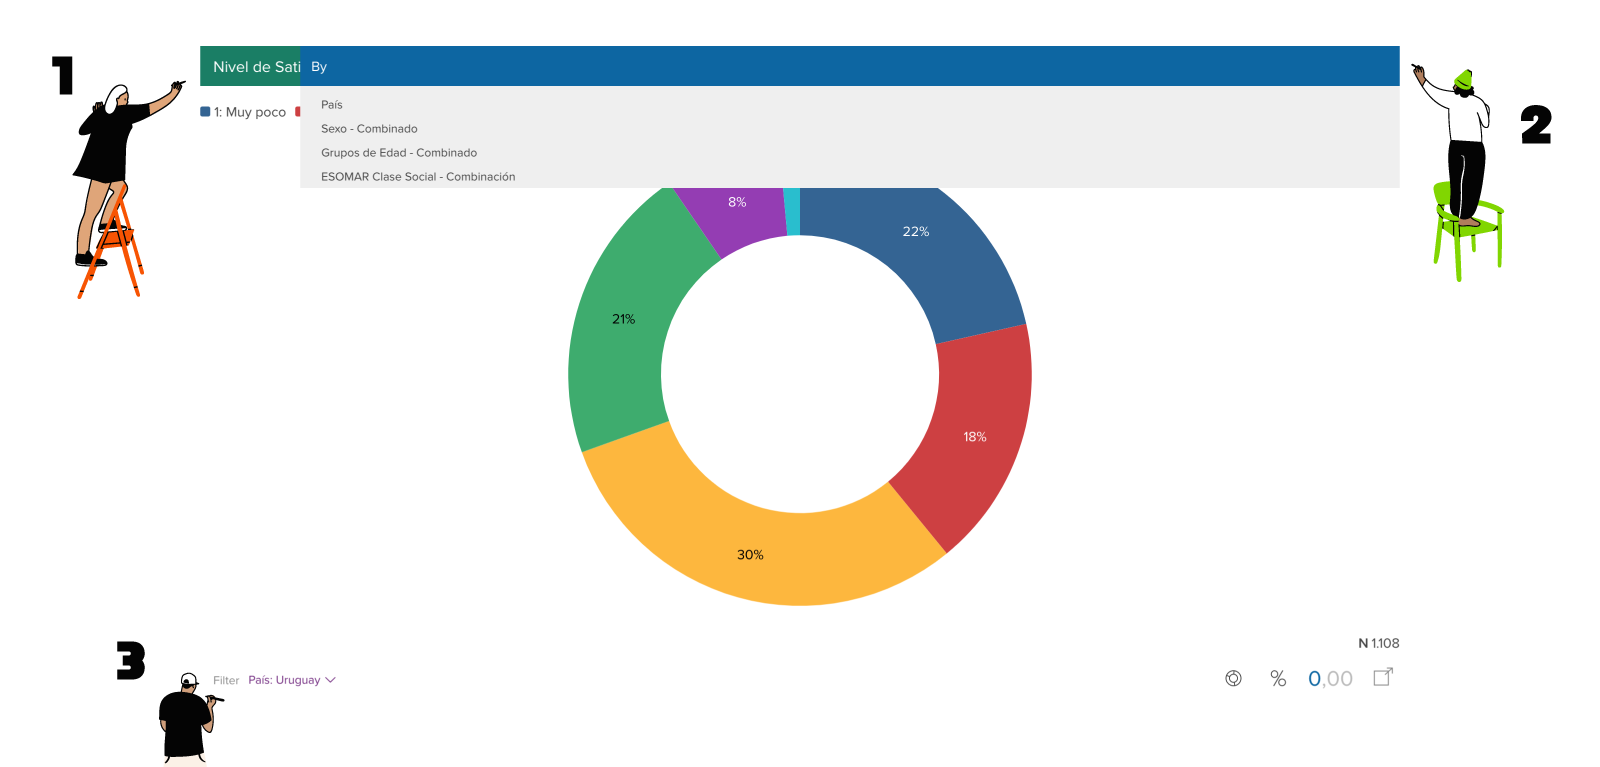
Do you want to see the data by country? Do the following:

1
The green button always selects the question
2
In the blue "By" button select "No selection" (If the "No selection" option is not displayed in the button options, it is already selected).
3
Under "Filter", located at the bottom left of the display, select the name of the country for which you want to view the data.
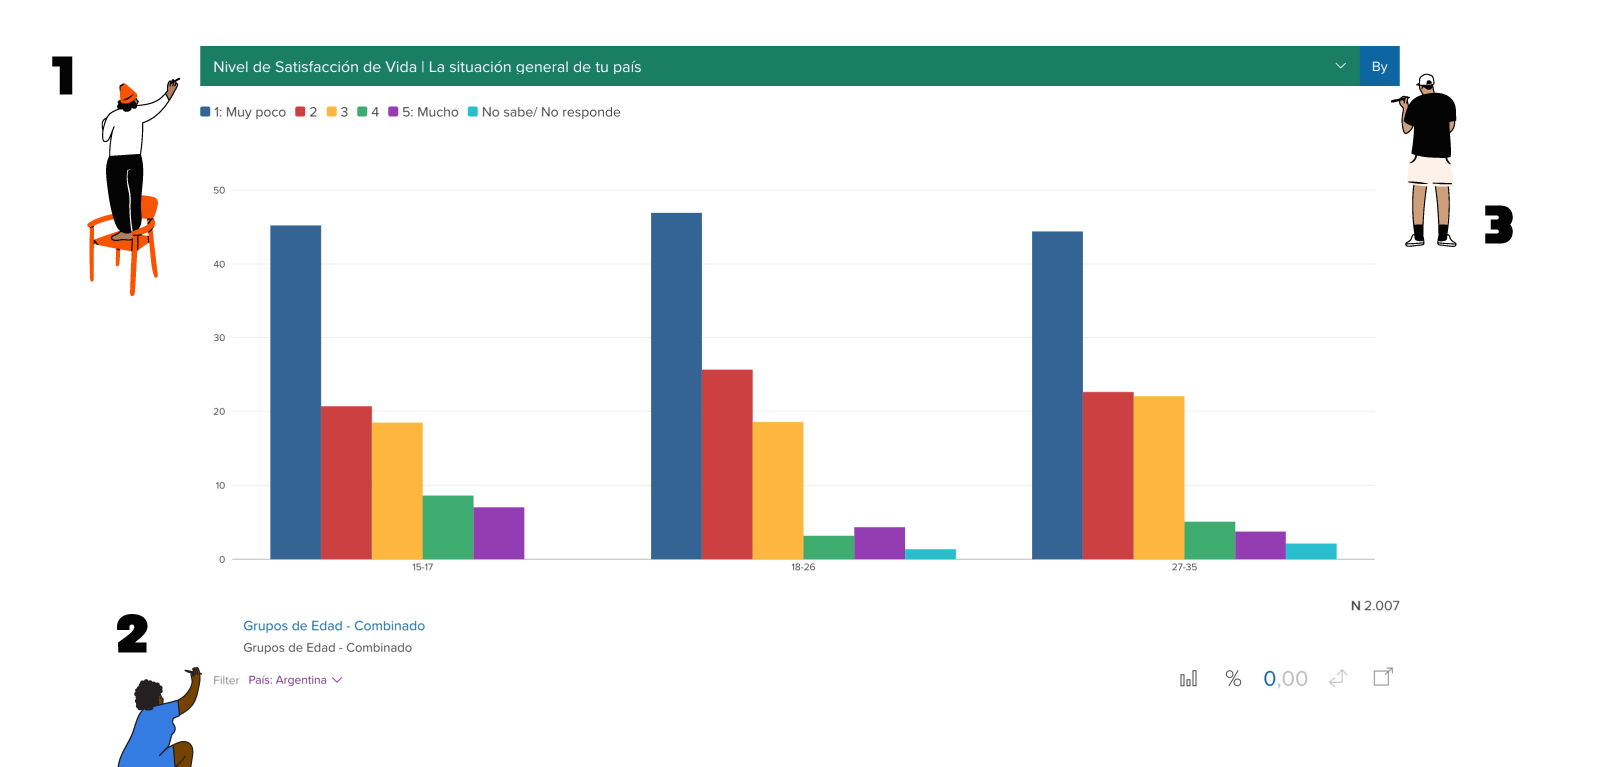
Do you want to see the data of a question by country crossed by age/sex/class variables?

1
The green button always selects the question
2
Under "Filter", located at the bottom left of the display, select the name of the country you want to view the data.
3
Clicking on the blue "By" button displays the options to view the crosstabulated data by 3 variables: sex, age cohort and social class. Select the one you want.